Studio
A local, Docker-Desktop-style dashboard for your deployments — live metrics, logs, chat, and cost history.
llmrun studio starts a local web dashboard for everything you'd otherwise juggle across llmrun ls, logs, cost, and history. It binds to 127.0.0.1 only — nothing about your deployments is ever exposed outside your machine.
llmrun studio              # opens http://127.0.0.1:4173 in your browser
llmrun studio --no-browser # just start the server
Local and durable
Everything in studio reads from the same durable, local-only usage ledger (~/.llmrun/history.jsonl) as llmrun cost and llmrun history. Saved chat conversations and cost totals survive llmrun down — the ledger is never touched by a deployment's rm -rf, only by llmrun history --clear.
Overview
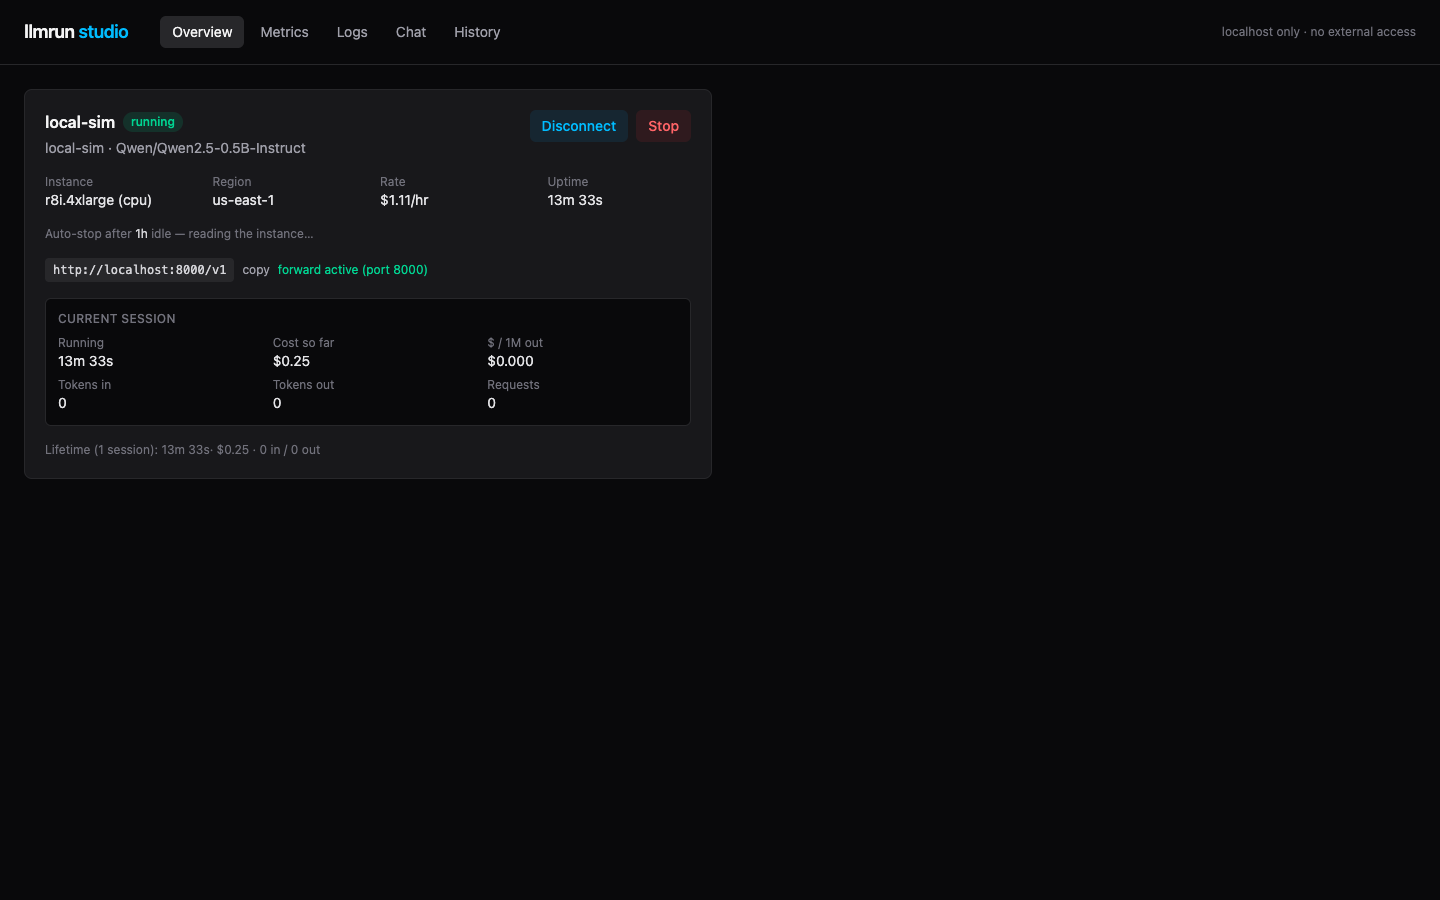
Every deployment you have — running or stopped — gets a card: state, endpoint, instance type, forward status, hourly rate, uptime, and the current session's running cost. Stop, start, connect, and disconnect all work directly from here.
Metrics
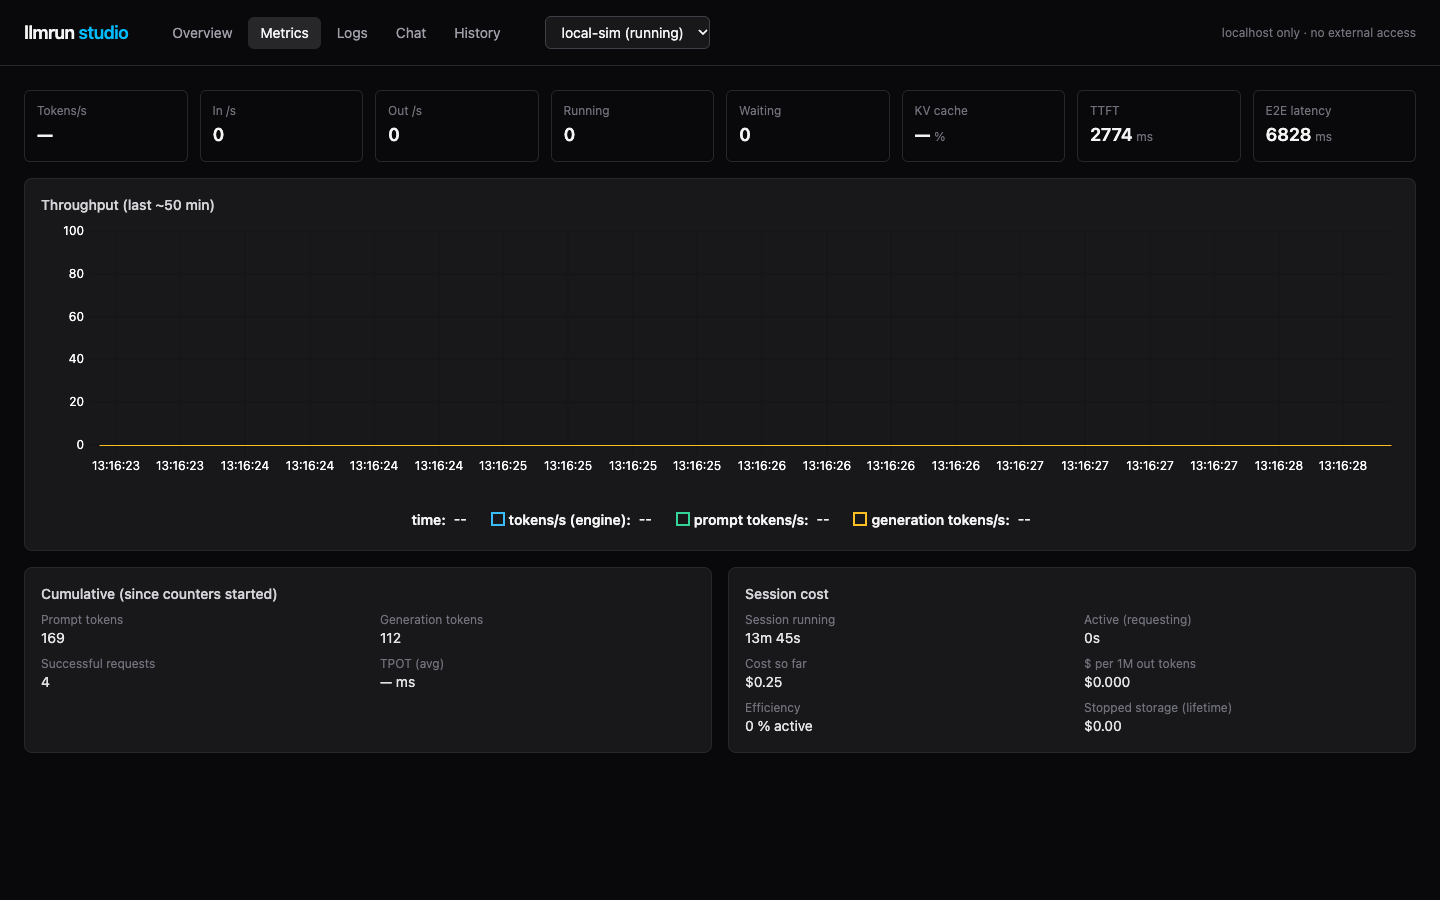
Live charts sourced straight from vLLM's own /metrics endpoint over the SSM port-forward — no separate monitoring stack. Tokens/s, prompt vs. generation throughput, running/waiting requests, KV-cache usage, time-to-first-token, and end-to-end latency, alongside session cost and a running $ / 1M output tokens figure.
CPU fallback deployments
If a deployment is running the Ollama CPU fallback instead of vLLM, metrics aren't available (Ollama doesn't expose a Prometheus endpoint) — the tab shows a simple placeholder instead of failing.
Chat
A ChatGPT-style interface against the served model: streaming responses, stop mid-generation, per-message token counts, a params popover (temperature, max tokens, system prompt), and a conversation switcher. Conversations persist in the usage ledger, so they're still there after llmrun down — useful for going back to something a model said weeks after you tore the instance down.
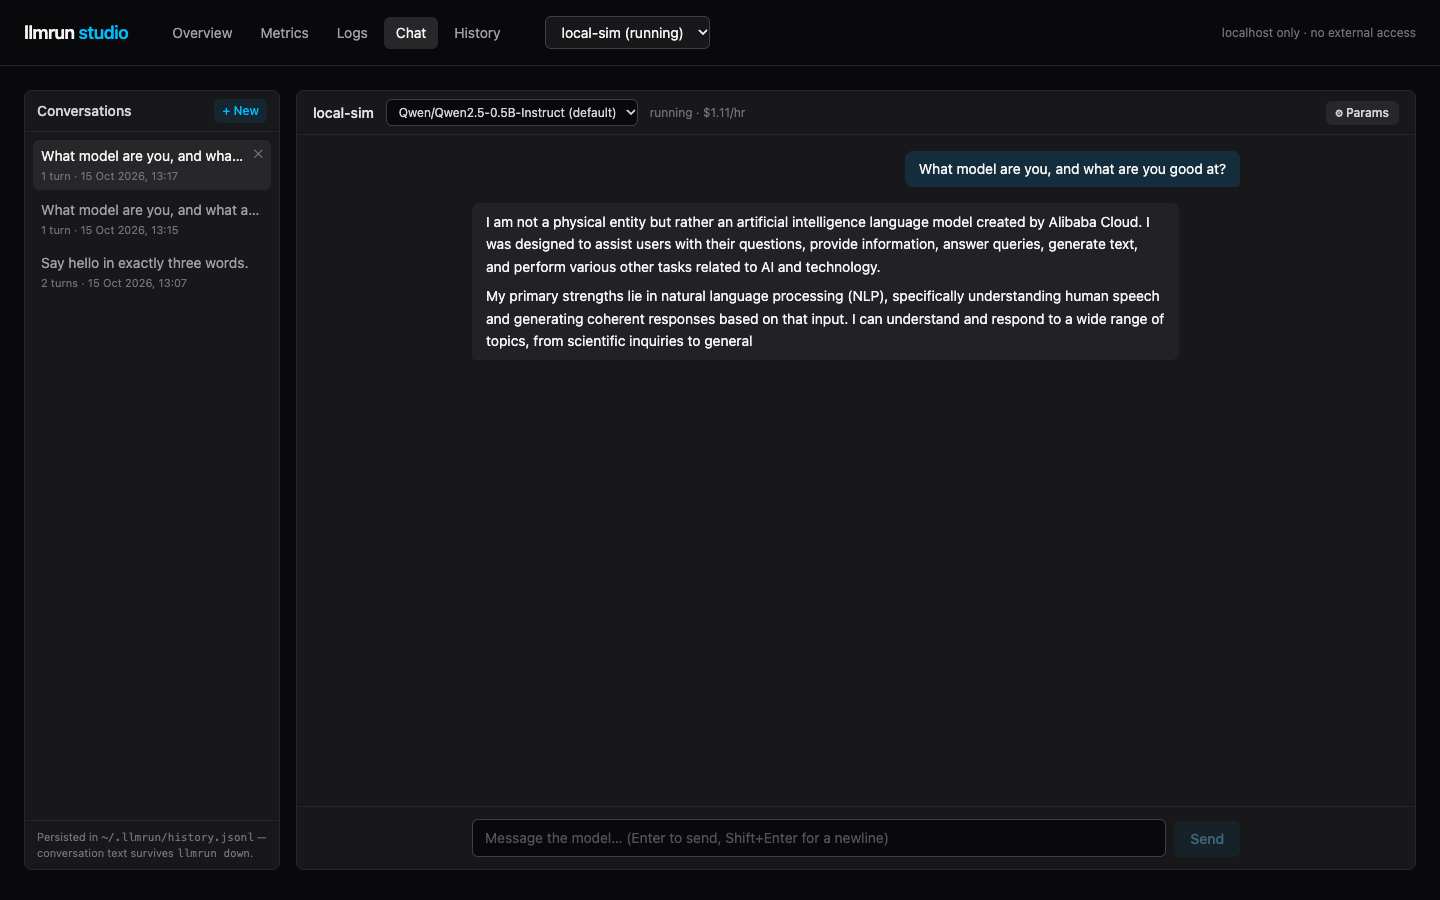
Chatting also counts as activity against your idle_timeout — a side effect worth knowing about, not a bug: it keeps the instance warm while you're actively using it through the dashboard.
Logs
Streams journalctl -u llmrun-server from the instance over SSM in real time, with a filter box, pause/autoscroll, and log-level coloring — the same stream llmrun logs tails, in the browser.
History
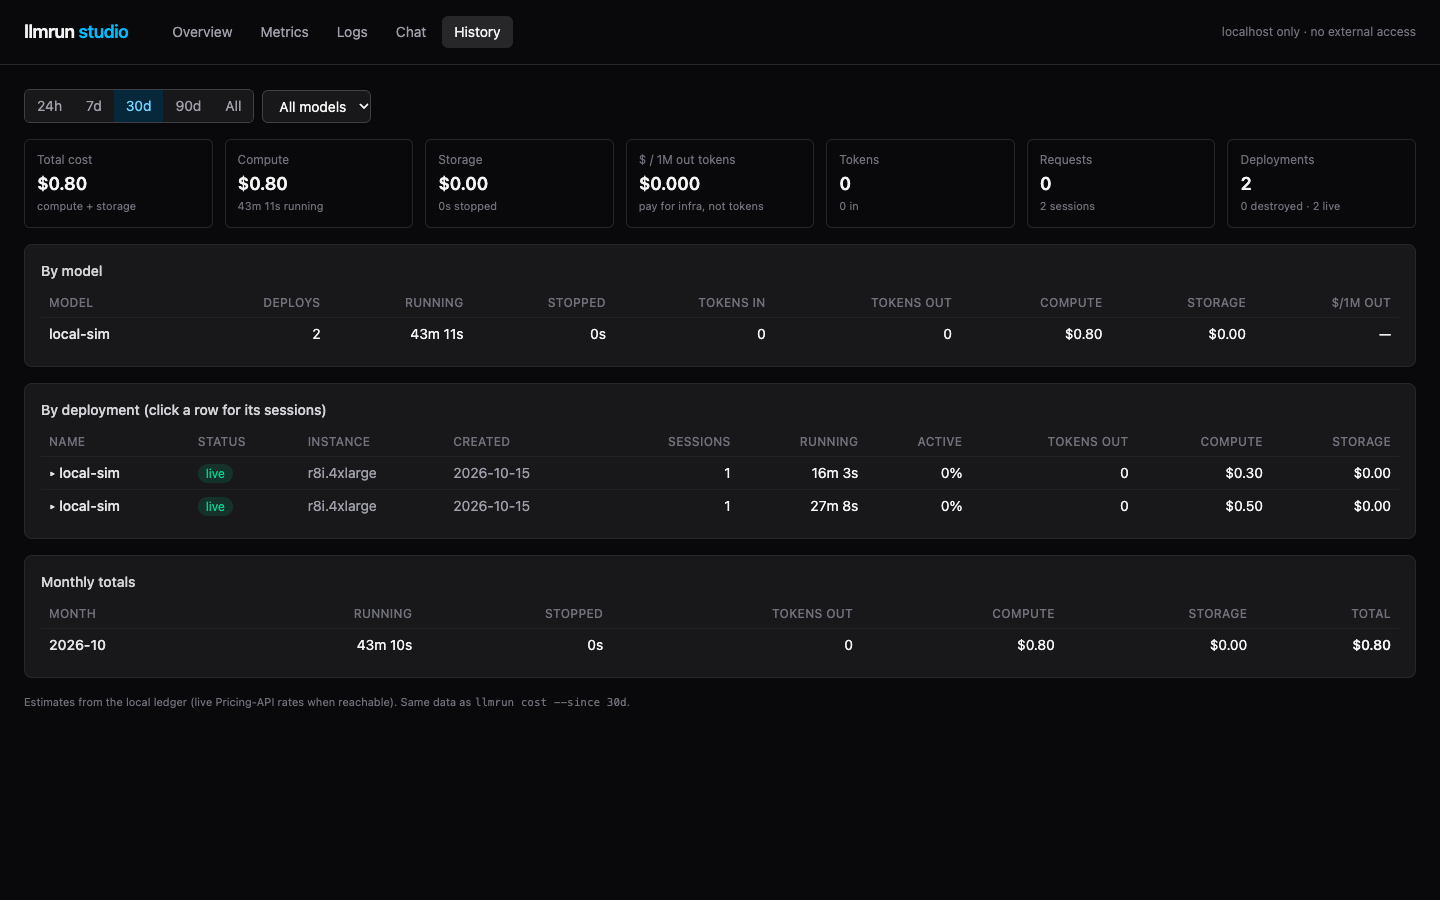
Cross-deployment aggregates: total cost, compute vs. stopped-storage split, tokens in/out, a per-model breakdown, a per-deployment session table, and monthly totals. This is llmrun cost and llmrun history as a dashboard, filterable by time range and model — and it includes deployments you've already destroyed.
What studio doesn't do (yet)
- No config changes. Editing
idle_timeout, context length, or other server flags from the dashboard is on the roadmap but not built — usellmrun.yamland re-provision for now. - No GPU telemetry panel. VRAM/utilization charts aren't wired up yet;
nvidia-smioverllmrun sshstill works. - No remote access. The bridge only ever binds
127.0.0.1— there's no mode that exposes it beyond your machine.